pie(...) funtion plot a pie chart. It's usage is:
pie(x, labels = names(x), edges = 200, radius = 0.8,
clockwise = FALSE, init.angle = if(clockwise) 90 else 0,
density = NULL, angle = 45, col = NULL, border = NULL,
lty = NULL, main = NULL, ...)
x: Vector of each pie slice areas
labels: Vector of Pie slice names
edges: Pie circle border
radius: Pie circle radius
clockwise: Data direction, default is not clockwise
...
First let's make a simple pie chart:
>x <- c(3,2,6,8,4)
>pie(x)

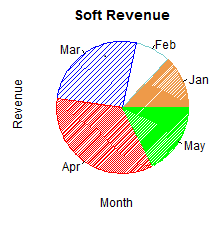
Let's add some annotations, including a title (main=),
color (col=), pie slice names (labels=),
etc:
>pieplot(x,labels=c("Jan","Feb","Mar","Apr","May"),xlab="Month",
+ ylab="Revenue", col=c("tan2","darkslategray3","blue","red","green"),
+ density=c(0,5,20,50,100), main="Soft Revenue")

pie3D(x,edges=NA,radius=1,height=0.1,theta=pi/6,start=0,border=par("fg"),
col=NULL,labels=NULL,labelpos=NULL,labelcol=par("fg"),labelcex=1.5,
sector.order=NULL,explode=0,shade=0.8,mar=c(4,4,4,4),pty="s",...)
x:
a numeric vector for which each value will be a sector
edges: the number of lines forming an ellipse
radius: the radius of the pie in user units
height: the height of the pie in user units
theta: The angle of viewing in radians
start: The angle at which to start drawing sectors.
border: The color of the sector border lines
col: The colors of the sectors
labels: Optional labels for each sector
labelpos: Optional positions for the labels (see examples)
labelcol: The color of the labels
labelcex: The character expansion factor for the labels
sector.order: Allows the operator to specify the order in which the sectors are drawn.
explode: The amount to "explode" the pie in user units
shade: If > 0 and < 1, the proportion to reduce the brightness of the sector color to get a better 3D effect.
mar: Margins around the pie.
pty: Whether to force a square plot region or not.
> install.packages("plotrix", repo="http://cran.r-project.org",dep=T)
> library(plotrix)
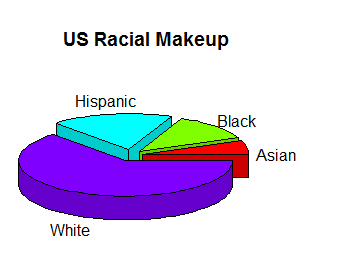
> x <- c(6, 12.4, 18.3,63)
> labl <- c("Asian", "Black", "Hispanic", "White")
> pie3D(x, radius=0.9, labels=labl, explode=0.1,
main="US Racial Makeup", labelcex=1)
